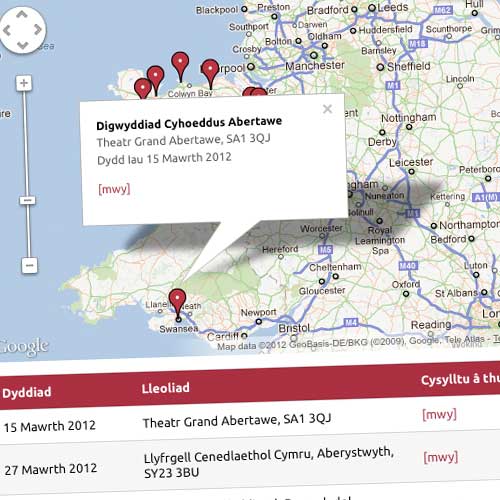
Bilingual maps with a WordPress custom post type


Puffbox’s longest-standing working relationship in Whitehall is with the Wales Office; it was there, don’t forget, that the whole WordPress-in-government thing started back in late 2007. We moved them on to a multisite setup just before the 2010 general election; and we’re seeing the benefits, through sites like the one we launched in November for the Commission for Devolution in Wales.
They’re about to start a round of public engagement events, and they asked us if we could add a Google Map to the site… which, of course, is bilingual, English and Welsh. It’s not rocket science these days, but it’s probably the smoothest implementation I’ve done, and I thought it might be worth sharing.
We’ve defined ‘event’ as a custom post type, non-hierarchical (ie more like posts than pages), with a full set of fields. It gives the ‘more info’ pages a nice URL, and keeps them nicely self-contained, with benefits for both admin interface and template access.
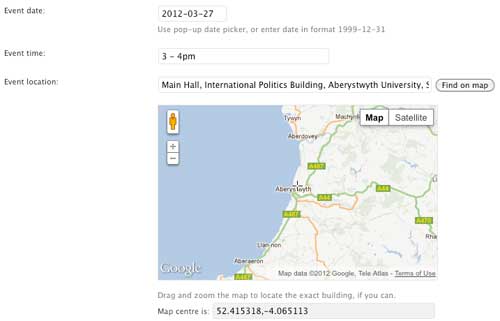
We’ve then added a ‘metabox’ to the ‘edit’ screen, for the various elements which define an event: basically date, time and location. When you click into the ‘Event date’ box, you should get a popup jQuery-based calendar – but if you don’t for some reason, or if you’re a keyboard wizard, you can still enter it manually. We’ve left the ‘time’ field freeform: we didn’t plan to do anything too clever with the event times, and besides, times are often rather vague.
I’m quite pleased with how we’re doing the location. We ultimately want two things: a text-based name, which should make sense to humans rather than computers; and an exact geolocation, ideally latitude and longitude, for the machines. So, looking down the page, first thing you come to is a text search box. If you know the address, particularly if you have a postcode, you can enter it here; then click ‘find on map’. This sends the query to Google, and makes a best-guess for the precise location, indicated by the crosshair hovering over the centre.
Google’s guesses are usually pretty good, as you’d expect. But you can fine-tune them by dragging the map around – even to the specific building. And every time the map moves, whether via the search or via dragging, the coordinates update automatically.
The text name and the coordinates are saved separately – which means, once you’ve pinpointed your venue, you can then go back and edit the text-based name, to make it less of a search query, and more of a human-friendly description.
That gives us enough data to put the markers on the map – with accuracy down to a few metres if you’re so inclined! – and to generate some meaningful text content too, in the form of a table and stand-alone page. And yes, we’ve got all the info in both English and Welsh – although this site predates our work on Babble, so it uses WPML. (I say ‘all’: it turns out, Google Maps doesn’t do Welsh.)
Finally – and you’ll have to take my word on this, for the moment – as time passes, and events take place, they start to appear ‘greyed out’ on the map. We’re using the Google Chart API to generate the map markers, and it’s dead easy to change the base colour in the javascript. (The rows in the table get ‘greyed out’ too.)
Like I say, it’s not rocket science. But it’s always a joy when you can hand what is actually quite complex functionality over to a client, and it just works*.

Constituency maps in under a minute

Opening up geographic data is beginning to bear fruit. MySociety’s Matthew Somerville has just unveiled MaPit, ‘our database and web service that maps postcodes and points to current or past administrative area information and polygons for all the United Kingdom.’ What that means in practice is, postcode lookups and boundary data are now just a URL away.
(Quick update: actually, not for all the United Kingdom as it turns out – the following method doesn’t work for N Ireland. See Matthew’s comment below.)
Here’s a quick example, as much for my own future reference as anyone else’s. Let’s say you wanted to generate a map of a given MP’s constituency – say Lynne Featherstone in Hornsey & Wood Green:

  • You need to find the appropriate reference number for the constituency: either by browsing the list of all constituencies, or searching for places whose names begin with Hornsey. Note – these will produce nasty-looking data files, rather than pretty HTML lists. Hunt through the code, and you’ll find:
    “65883”: {“codes”: {“unit_id”: “25044”}, “name”: “Hornsey and Wood Green”, “country”: “E”, “type_name”: “UK Parliament constituency”, “parent_area”: null, “generation_high”: 13, “generation_low”: 13, “country_name”: “England”, “type”: “WMC”, “id”: 65883}
  • The ‘id’ is the number you need – in this case, 65883. The MySociety API now lets you call the geometry of that area, in – among others – Google Earth’s KML format, using the following URL. (Don’t worry about the ‘4326’ here: it’s a reference to the coordinate system being used, and won’t change in this context.)
    http://mapit.mysociety.org/area/4326/65883.kml
  • Conveniently, Google Maps lets you enter a KML file’s URL as a search query, and it will draw it on a map. Even more conveniently, if you add ‘output=embed’ as a search parameter, it strips away everything but the map itself. So here’s an embedded map of Lynne’s constituency, pulled into an <iframe>. Look at the source code, to see how easy it is.

Boundary data generated by MaPit.mysociety.org which contains Ordnance Survey data © Crown copyright and database right 2010; Royal Mail data © Royal Mail copyright and database right 2010 (Code-Point Open); National Statistics data © Crown copyright and database right 2010 (NSPD Open).
And thankfully, it bears a close resemblance to this map on Lynne’s own website, which took me considerably longer to churn out.

Ordnance Survey data 'will' be freed

It’s quite amusing to compare and contrast the announcements from DCLG and Ordnance Survey today, regarding boundaries, postcode areas and mid scale mapping information. DCLG’s press release proudly declares:

The Prime Minister and Communities Secretary John Denham will today announce that the public will have more access to Ordnance Survey maps from next year, as part of a Government drive to open up data to improve transparency. Speaking at a seminar on Smarter Government in Downing Street … the Prime Minister will set out how the Government and Ordnance Survey, Great Britain’s national mapping agency, will open up its data relating to electoral and local authority boundaries, postcode areas and mid scale mapping information. The Government will consult on proposals to make data from Ordnance Survey freely available so it can be used for digital innovation and to support democratic accountability.

See that? Lots of definite statements, of how they will do this, will do that. Well, hold your horses. Ordnance Survey’s rather brief press release is slightly more defensive, and markedly less excitable:

The Prime Minister has today announced that the public and others will have greater access to a range [of?] Ordnance Survey data from next year, as part of a Government drive to open up data to improve efficiency and transparency. The detail of this is still being worked through and a formal consultation period will begin in December to look at how these changes will be implemented.

So whilst DCLG see it as a chance to crowdsource some cool stuff, OS frame it purely in fairly boring accountant-bureaucrat terms. Hmm.
Of course it’s welcome news, but there’s a long, long way to go yet – and not much time to do it. With a general election on the horizon, boundaries absolutely must be freed – as quickly as possible, and in formats which will be most useful to the digital innovators. (Basically, that means dead easy integration with Google Maps.)
Oh, and let’s not get carried away about ‘postcode areas’. They aren’t Ordnance Survey’s to free, are they?

Ordnance Survey's new approach

ordsvystrategy
Over the last few weeks, I’ve been working with Ordnance Survey to produce a WordPress version of their new business strategy, published today. As you’ll immediately spot, it’s another piece of work based on Steph Gray’s Commentariat theme, including some of the tweaks I did for BERR’s Low Carbon Strategy.
As I write this, I’ve literally just pressed the ‘go’ button, so I haven’t even read the document yet myself, and can’t offer any opinion on it (yet). But I didn’t hide my disappointment at the unveiling of the OpenSpace project a year ago, and I’m told things have moved much further forward on that front at least. It hasn’t been enough to satisfy the Guardian’s Free Our Data campaign, though.
I know this is a subject of considerable interest to the e-government / activist community, which probably covers most of you reading this. We’ve created a web-friendly platform for you to read what OS are proposing, and tell them what you think about it. What are you waiting for?

Wiped off the map

romseyroad
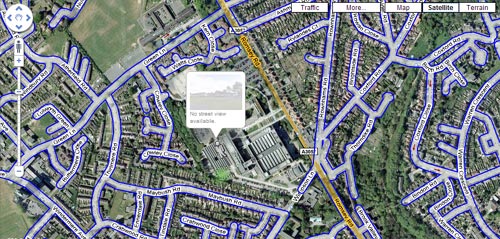
I’ve come across a rather curious anomaly in Google’s new Street View. Southampton is one of the cities covered in the initial UK rollout… or rather, most of Southampton. You’ll note the bizarrely unavailable stretch of Romsey Road… and the odd interruption of Wimpson Lane. Here’s a link to it in Street View, to see for yourself.
So… who do you think operates from this unmapped building? If you need a clue, read this piece I wrote late last year: ‘Ordnance Survey ban Google Maps‘.
Of course, I’m sure there’s a perfectly good reason.

Crime maps by Christmas

A Home Office press release this morning makes the explicit pledge: ‘Every neighbourhood in England and Wales will have access to the latest local crime information through new interactive crime maps. […] By the end of the year every police force area will produce crime maps which will allow the public to see where and when crime has happened, down to street level for some crimes; make comparisons with other areas; and learn how crime is being tackled by their local neighbourhood policing team.’
On the face of it, that’s brilliant news. But five months to do this? That’s brave – especially when we’re looking at some pretty fundamental legislative questions, as highlighted on the Power of Information blog last week. The Guardian’s Free Our Data campaign blog has a few recent items along similar lines.

Ordnance Survey reinvents Google Maps

‘Following a successful closed launch’, apparently involving no fewer than 12 developers, Ordnance Survey has opened the doors to OpenSpace. It describes itself as ‘a JavaScript® Application Programming Interface (API) that uses ‘slippy map’ technology, letting you dynamically pan the map by grabbing and sliding the image in any direction you like.’ Just like Google Maps, then. But there’s more.
‘OS OpenSpace allows you to build Web 2.0 applications using Ordnance Survey data’ – just like Google. You can ‘add markers, lines and polygons on top of Ordnance Survey maps, and also search for place names’ – just like, er, you know. Oh, except that it’s ‘non-commercial use only’. According to their FAQ: ‘There can be no advertising, paid promotional content or other revenue generating activities associate (sic) with any part of your website.’ Which doesn’t leave much.
There’s a page listing various usage examples: but guess what? The examples are all non-interactive GIFs… which kind of defeats the object. Duh.
I’d love to get excited by this. OS is finally speaking the right language: API, web 2.0, mashup, etc. But they have to give developers a better reason to use this than their claim of having ‘the best mapping data available’. They’re already way, way behind.
Quick update: see comments from Ed Parsons – ex-OS, now ‘the Geospatial Technologist of Google’: ‘not quite what I had opened Openspace would be, but given the constraints … a great first step and will hopefully lead to the much needed rethink.’